Serial or COM port-based applications are essential to many developers’ daily tasks, particularly for data capture and analysis. One important tool in this workflow is Serial Port Sniffer software, a program that offers comprehensive visibility into communication over RS232, RS422, and RS485 interfaces. Developers commonly use such tools for debugging, testing, or reverse engineering.
Among the specialized programs in this space is Serial Port Monitor (SPM). This software captures real-time COM port activity and displays it in various formats suited to different development needs. SPM is a reliable, high-performance solution for fast and effective troubleshooting or communication protocol fine-tuning.
In this article, we’ll guide you through how to set up your serial port sniffer on Windows and configure its settings correctly. This will enable you to start a monitoring session and save the results for future analysis.
How to Set Up COM Port Sniffer
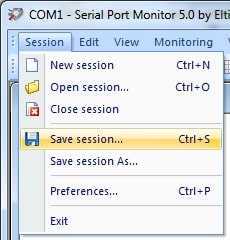
Below, you’ll find step-by-step instructions on how to start a COM port monitoring session with SPM and save it to a file after serial communication ends.
- First, you download it on your computer. The app is compatible with Windows XP/2003/2008/Vista/7/8/10 (both 32-bit and 64-bit).
- Then, you install the program and launch it. Once your RS485 sniffer is up and running, it’s time to start a monitoring session.
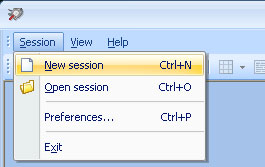
- To do this, head to the main menu of Serial Port Monitor and choose Session > New session. Also, you can use the shortcut ‘CTRL + N’ or click the ‘New’ icon on the main toolbar.

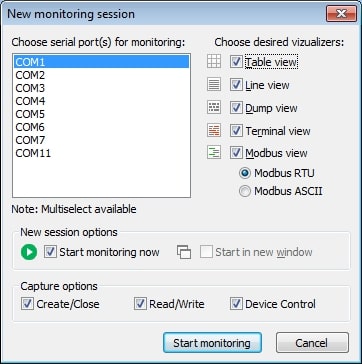
- In the “New monitoring session” window that will appear, enable a visualizer for displaying captured serial data.
The software provides four data viewing modes. They are Line, Table, Terminal, Dump and Modbus views. You are able to select one or all of them at once.
- Next, select the events to monitor: Read/Write, Create/Close or Device Control.
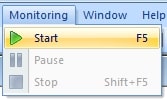
- Finally, hit “Start monitoring”.

Here you go!


